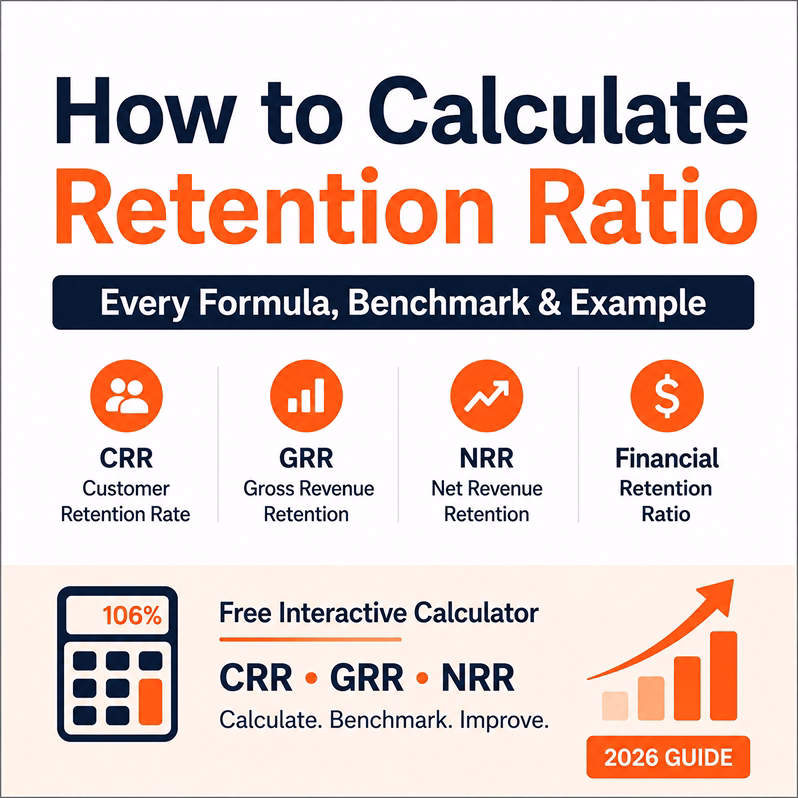
How to Calculate Retention Ratio: Every Formula, Benchmark & Example (2026 Guide)
Learn every retention ratio formula — CRR, NRR, GRR, and the financial plowback ratio — with worked examples and 2026 industry benchmarks.

TL;DR
- "Retention ratio" means different things in different contexts. In finance it is the share of net income kept instead of paid as dividends. In business operations it is the percentage of customers or revenue retained over a period.
- Customer Retention Rate (CRR) = (Customers at End − New Customers Added) ÷ Customers at Start × 100.
- Net Revenue Retention (NRR) includes expansion revenue and can exceed 100%. Gross Revenue Retention (GRR) excludes expansion and is capped at 100%.
- Median NRR for private B2B software companies is 106%, according to SaaS Capital. Cross-industry average CRR sits at approximately 72.5% for B2B businesses.
- A 5% improvement in retention can increase profits 25–95%, according to Bain & Company research cited in the Harvard Business Review.
Key Takeaways
- Customer Retention Rate (CRR) is a customer count metric that measures the percentage of existing customers retained during a defined period.
- Net Revenue Retention (NRR) is a revenue metric that measures recurring revenue retained plus expansion revenue from existing customers over a period, and can exceed 100%.
- Gross Revenue Retention (GRR) is a revenue metric that measures recurring revenue retained from existing customers, excluding expansion, and is always capped at 100%.
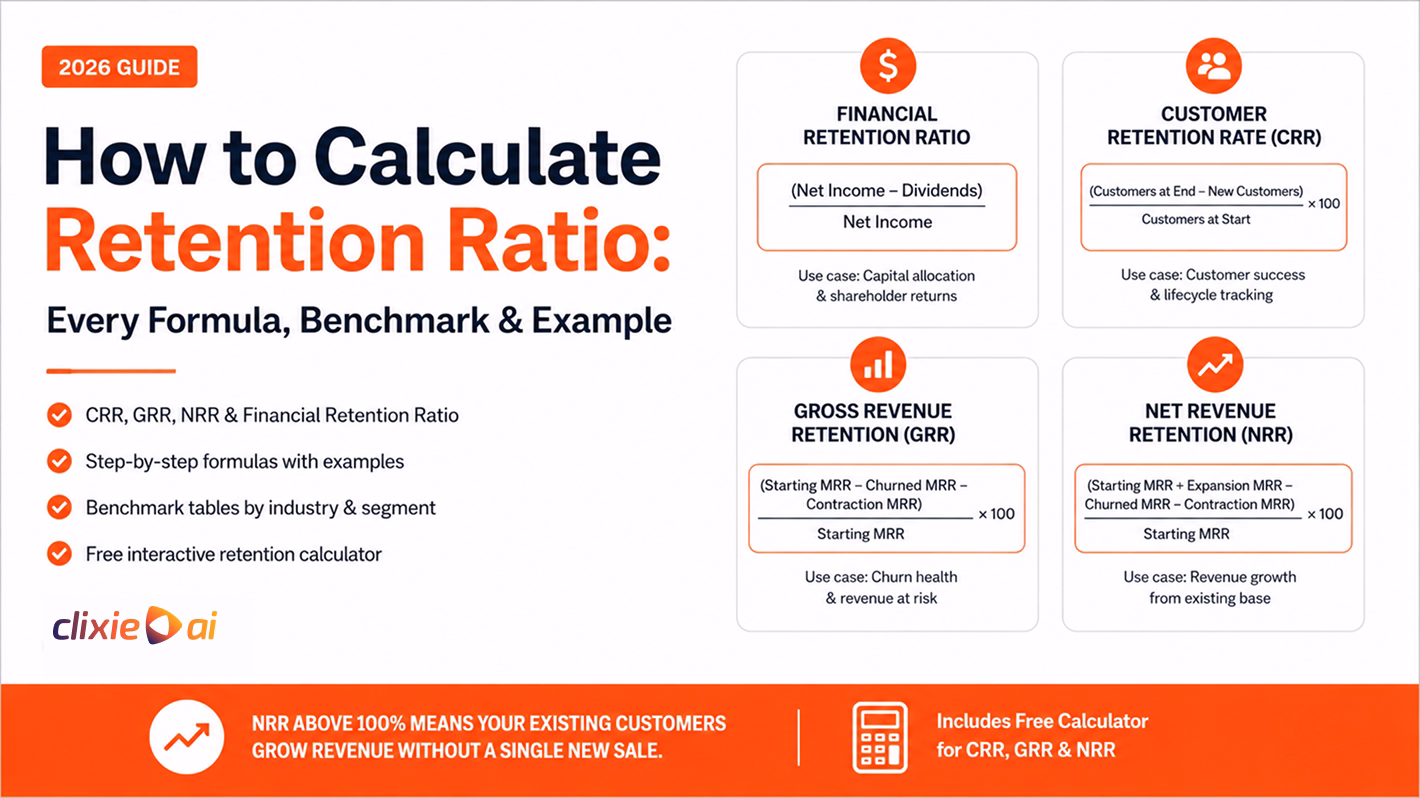
- Financial Retention Ratio is an accounting metric — also called the plowback ratio — that measures the proportion of net income a company keeps rather than distributing as dividends.
- Retention rate and churn rate are exact inverses: a 20% churn rate equals an 80% retention rate for the same period.
- NRR exceeds 100% when expansion revenue from upsells, cross-sells, and seat additions outpaces revenue lost to churn and contraction — a condition called negative churn.
Many search results for "how to calculate retention ratio" focus on a single definition — usually the financial plowback ratio — while operators searching the same phrase often need customer or revenue retention formulas. Both interpretations are correct. The term genuinely covers four different metrics depending on whether you are a finance analyst, a customer success leader, or a recurring revenue operator.
This guide covers all four. You will find the formula for the financial retention ratio, customer retention rate (CRR), gross revenue retention (GRR), and net revenue retention (NRR) — each with a worked example, the relevant benchmark, and the behavioral layer that explains what the number actually tells you about your business.
If you run video-driven sales or enablement, the video retention rate guide covers how viewer completion signals connect to customer retention, and the section below on interactive video explains how video engagement data can surface renewal risk before it shows up in your CRR dashboard.
📅 Ready to turn engagement signals into retention intelligence? Book a demo and see how Clixie.ai converts passive video into the behavioral data your customer success team can act on before churn happens.
What is retention ratio, and which definition applies to you?
"Retention ratio" covers two distinct concepts. In corporate finance, it is the percentage of net income a company keeps rather than distributing as dividends — the plowback ratio. In business operations, it measures the percentage of customers or revenue retained over a period. Which definition applies depends on whether you are analyzing capital allocation or tracking how well a business holds onto its customer base.
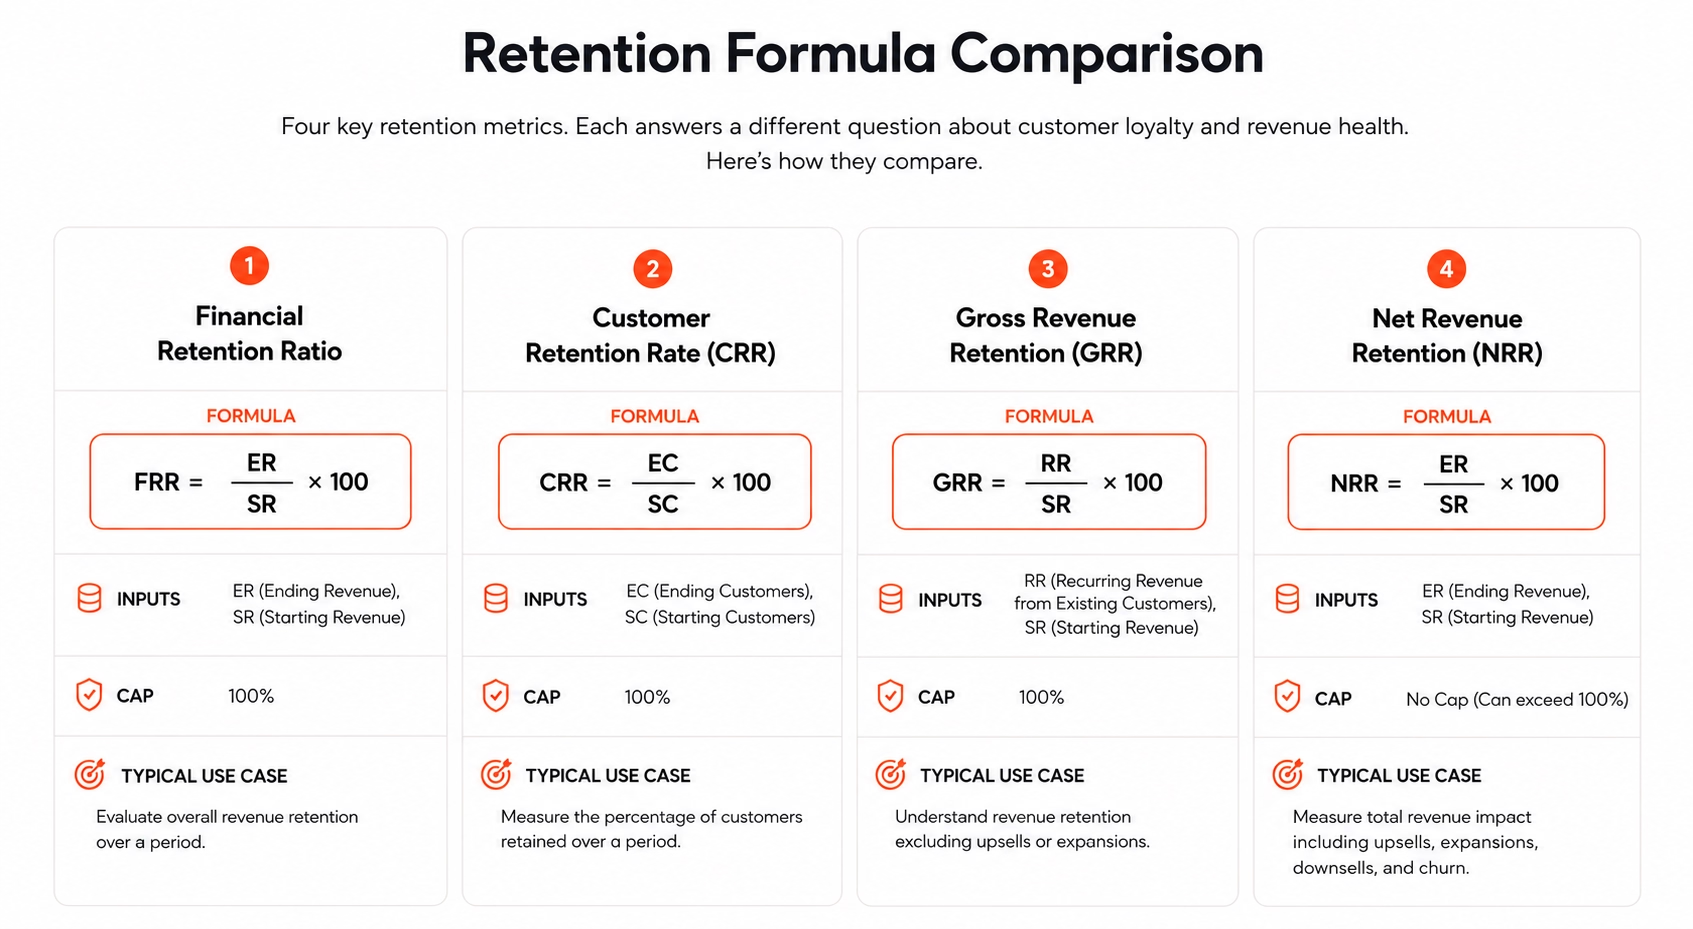
The confusion is common. When a finance analyst and a customer success leader both say "our retention ratio dropped," they are measuring different things and often talking past each other. Here is a quick map of the four retention metrics and when each one applies:
Each formula, worked example, and benchmark is in the sections below. Start with the row that matches your role, then use the benchmark section to assess your number against segment peers.
How do you calculate customer retention rate (CRR)?
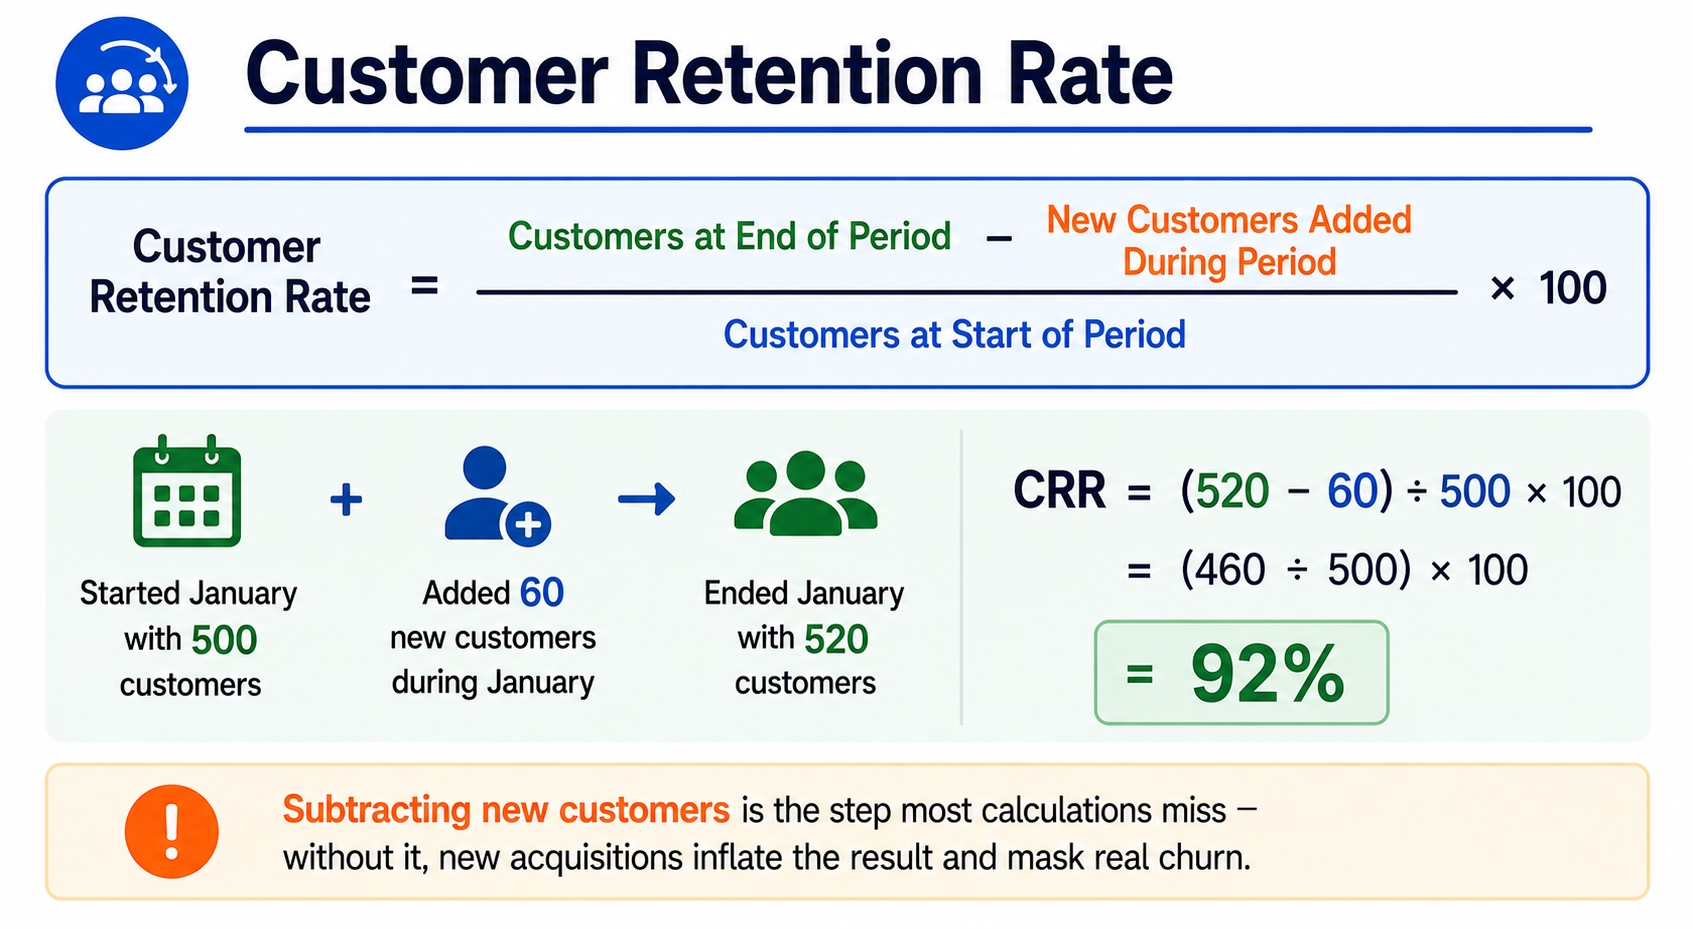
Customer Retention Rate = (Customers at End of Period − New Customers Added During Period) ÷ Customers at Start of Period × 100. If you started January with 500 customers, added 60 new ones, and ended with 520, your CRR is (520 − 60) ÷ 500 × 100 = 92%. Subtracting new customers is the step most calculations miss — without it, new acquisitions inflate the result and mask real churn.
The average CRR across B2B businesses sits at approximately 72.5%, according to CustomerGauge's research across B2B accounts. Rates vary sharply by industry: IT Services averages 88%, Insurance 83%, Banking 75%, Retail 63%, and Hospitality 55%, according to First Page Sage (2026).
Worked example across three time horizons
The same company shows very different CRR readings depending on measurement window. This is expected, not an error. Monthly CRR catches early warning signs but is noisy. Annual CRR captures full contract cycles but hides early-stage churn. Most subscription businesses track monthly and report quarterly.
CRR measures count, not value. A 92% CRR can coexist with a business in serious trouble if the 8% that churned were the three largest accounts. That is why GRR and NRR exist — they measure the revenue consequence of retention, not just the headcount result.
Retention is not only measured after churn happens — it can be predicted from engagement behavior. Customers who stop engaging with your content, product demos, or onboarding materials before renewal day are signaling risk weeks or months in advance. The sections on NRR and interactive video below explain how to close that gap.
Retention Rate Calculator: CRR, GRR & NRR
Manual formulas for reference:
- CRR = (Customers at End − New Customers Added) ÷ Customers at Start × 100
- GRR = (Starting MRR − Churned MRR − Contraction MRR) ÷ Starting MRR × 100
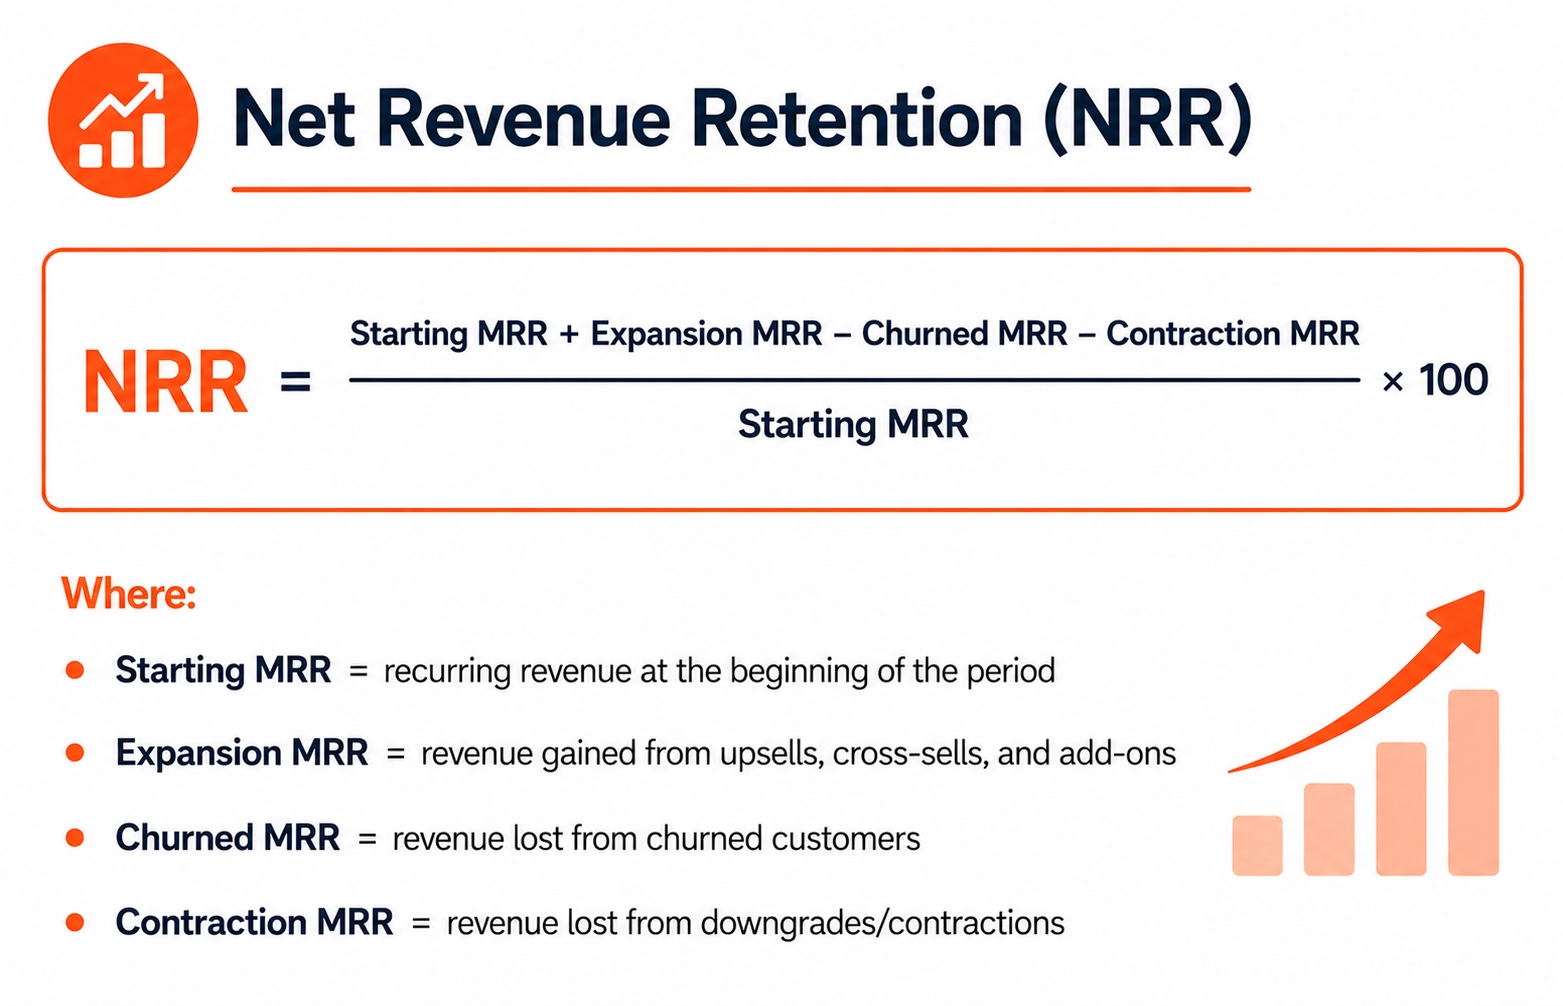
- NRR = (Starting MRR + Expansion MRR − Churned MRR − Contraction MRR) ÷ Starting MRR × 100
Example (all three):
- Starting MRR: $500,000 | Churned: $15,000 | Contraction: $5,000 | Expansion: $40,000
- GRR = ($500K − $15K − $5K) ÷ $500K × 100 = 96%
- NRR = ($500K + $40K − $15K − $5K) ÷ $500K × 100 = 104%
What is the financial retention ratio (plowback ratio) formula?
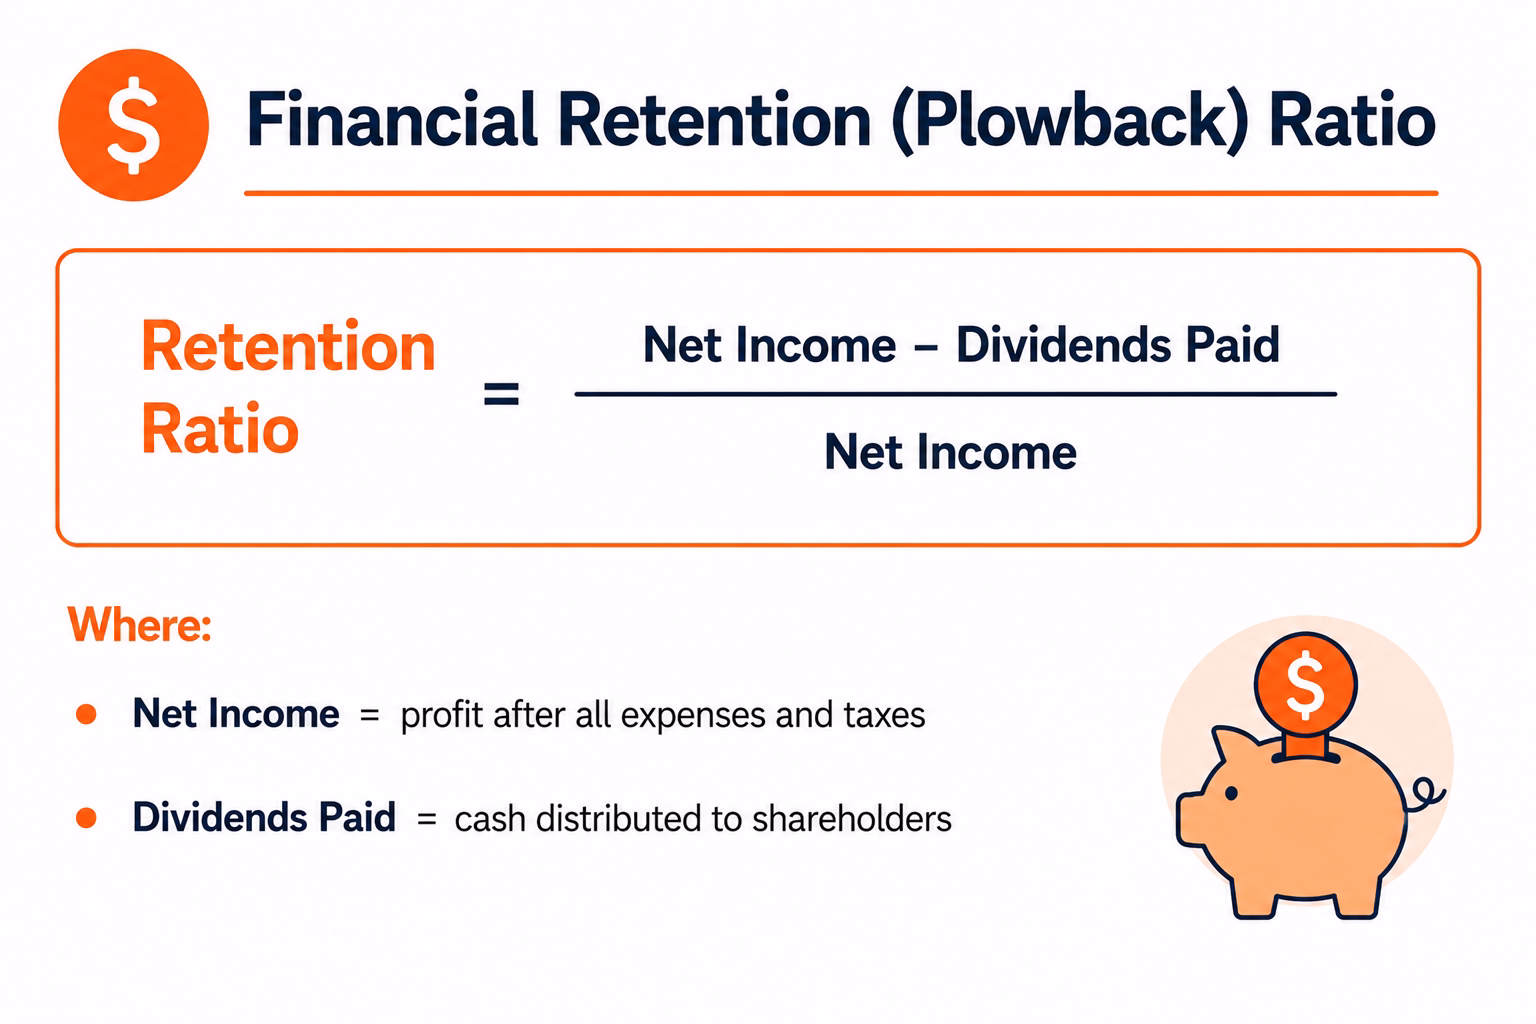
If a company earns $10M in net income and pays $2M in dividends, its retention ratio is ($10M − $2M) ÷ $10M = 80%. That 80% is reinvested in operations, R&D, debt repayment, or reserves. On a per-share basis: Retention Ratio = (EPS − Dividends Per Share) ÷ EPS.
According to the Corporate Finance Institute, the financial retention ratio and dividend payout ratio are exact inverses — they always sum to 1. A 70% payout ratio implies a 30% retention ratio. This inverse relationship is why analysts track retention ratio alongside earnings growth: a company that pays out most of its income has less capital available to fund future growth internally.
Growth-stage vs. mature company
A growth-stage technology company typically carries a retention ratio above 90% — nearly all earnings are reinvested because capital is productive and external funding is not required. A mature utility or consumer staples company may show 20–40%, distributing most profits because reinvestment opportunities are limited and shareholders expect income.
Always compare the financial retention ratio within an industry, not across industries. A 40% ratio is healthy for a utility. The same number for a software company signals stagnation. This is the same principle that applies to customer retention benchmarks — segment context matters more than absolute numbers.
The financial retention ratio feeds the sustainable growth rate (SGR): SGR = Return on Equity × Retention Ratio. A company with 15% ROE and an 80% retention ratio can sustain roughly 12% annual growth without external financing.
Note: If you are in customer success or revenue operations, this section is the one to skip. The financial plowback ratio is a completely separate metric from CRR, GRR, and NRR.
How do you calculate Gross Revenue Retention (GRR)?
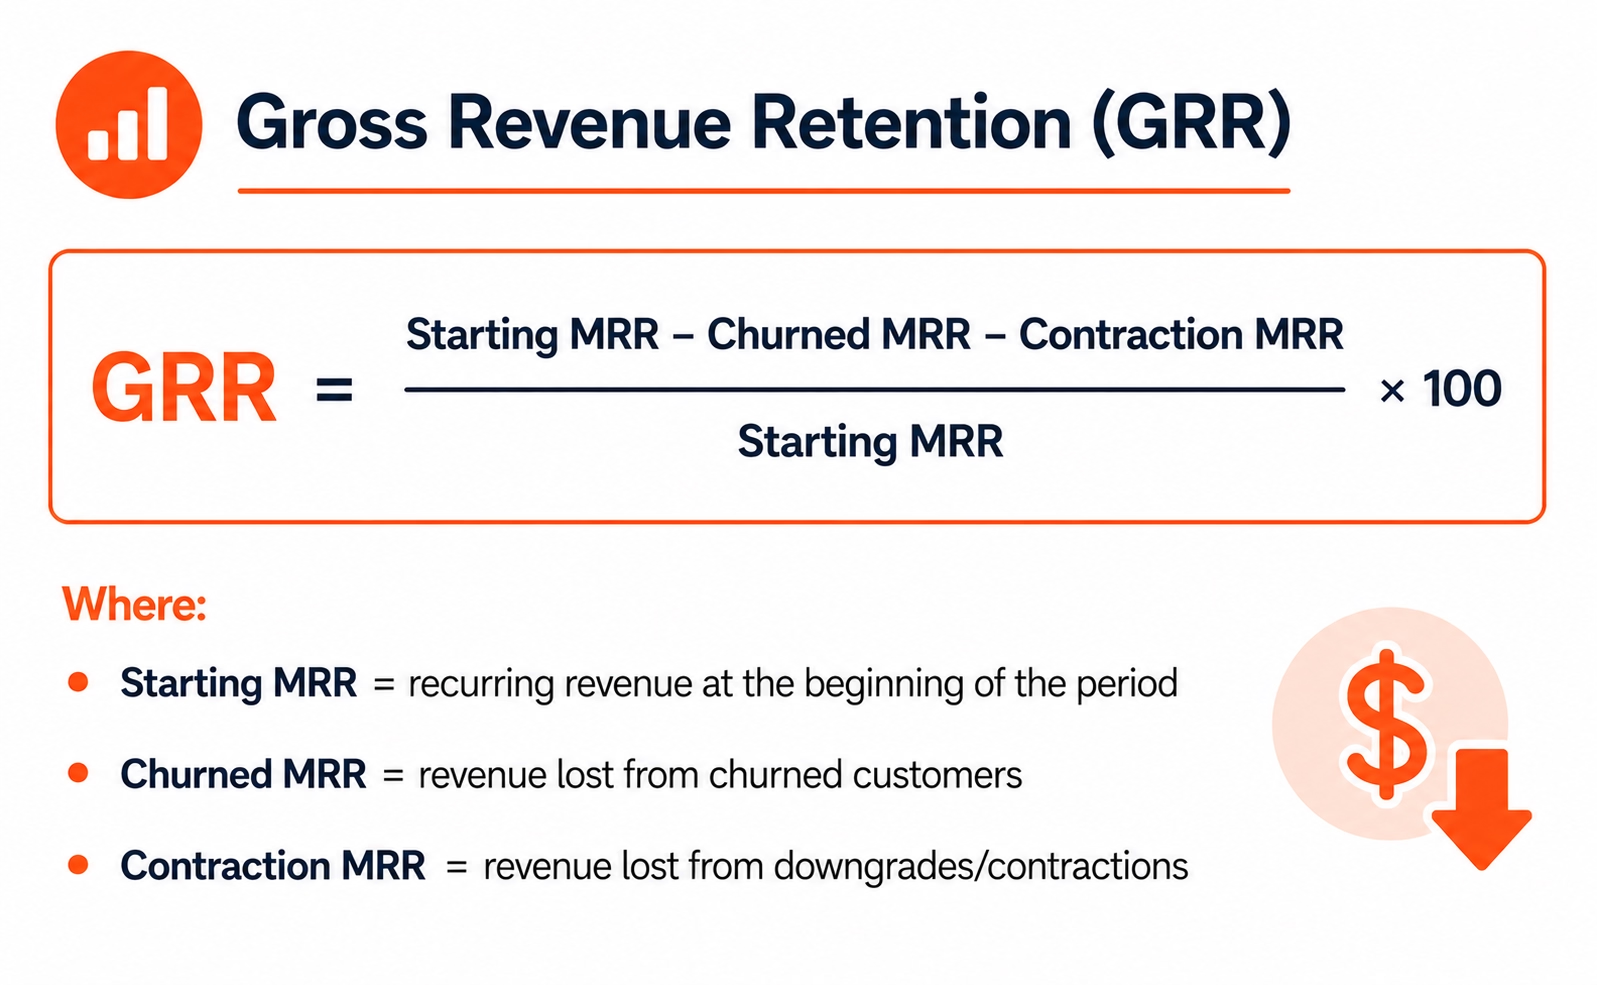
Gross Revenue Retention = (Starting MRR − Churned MRR − Contraction MRR) ÷ Starting MRR × 100. GRR is always ≤ 100% because it excludes expansion revenue entirely. If you started the month with $500K MRR, lost $20K to churned accounts, and $5K to downgrades, GRR = ($500K − $20K − $5K) ÷ $500K × 100 = 95%. The formula works identically using ARR for annual periods.
GRR benchmarks by customer segment, according to Ordway Labs and ChartMogul:
Think of GRR as the floor metric. It answers one question: how much of the revenue your business already has will still be there next period, assuming zero upsells? A high GRR means the core product delivers enough value that customers stay and maintain their spend. A low GRR means you are losing revenue faster than expansion can replace it — and that pattern eventually collapses.
GRR diagnoses churn health. NRR diagnoses overall revenue health. You need both. A company with 95% GRR and 98% NRR is retaining revenue well but failing to grow existing accounts. A company with 75% GRR and 105% NRR is papering over significant base erosion with expansion revenue — a fragile position that worsens when the high-value expanders churn.
How do you calculate Net Revenue Retention (NRR)?
Net Revenue Retention = (Starting MRR + Expansion MRR − Churned MRR − Contraction MRR) ÷ Starting MRR × 100. NRR can exceed 100%. Using the same base as above — $500K MRR — add $40K in upsells, subtract $15K churn and $5K contraction: NRR = ($500K + $40K − $15K − $5K) ÷ $500K × 100 = 104%. The 4 points above 100 mean your existing customer base grew revenue this period without a single new sale.
According to SaaS Capital, the median NRR for private B2B software companies is 106%. Breaking that down by deal size:
SaaS Capital's research also shows that moving NRR from the 90–100% range into the 100–110% range improves a company's annual growth rate by approximately 5 percentage points — without acquiring a single new customer.
What is negative churn?
Negative churn occurs when expansion revenue from existing customers outpaces revenue lost to churn and contraction. The result is NRR above 100%. This is not a rounding error — it is the most favorable position a recurring revenue business can be in. Every percentage point of NRR above 100% compounds year over year without incremental acquisition cost. The best-performing B2B software companies now average 120–125% NRR, meaning their existing base generates 20–25 cents of new revenue for every dollar of starting MRR even after accounting for all churned accounts.
NRR above 100% means your existing customer base grows revenue without a single new sale. Every percentage point above 100% compounds year over year — the same mathematical force as compound interest, applied to customer relationships.
At Clixie, we consistently see that the traditional 60-day renewal window is actually a trailing indicator. For instance, we worked with a B2B SaaS client whose Customer Success team was blind-sided by mid-market churn despite 'stable' seat utilization.
By replacing their static PDF onboarding guides with an interactive, branching Clixie video playlist, we exposed the real behavioral layer. We tracked the specific paths users took. When an account's completion rate on the 'Advanced Feature Integrations' branch dropped below 40% in the first 30 days, it triggered an automated high-risk alert in their CRM. This allowed the CS team to proactively intervene, identifying expansion opportunities and surfacing risk months before the actual renewal conversation.
What is a good retention rate, and how does your number compare?
A good retention rate depends entirely on your segment, business model, and customer type. For B2B businesses, the average CRR is approximately 72.5%. For subscription software, 100–120% NRR is considered good; above 130% is best-in-class, according to SaaS Capital. The most useful benchmark is not the industry-wide average — it is the median for companies with the same average contract value and go-to-market motion.
Full reference table — NRR/GRR from SaaS Capital, industry CRR from First Page Sage (2026):
.avif)
One important distinction: a company can simultaneously post 80% CRR and 110% NRR. Both numbers are true. The 80% CRR means 20% of customers left. The 110% NRR means the accounts that stayed grew spend enough to outpace what was lost. Both metrics belong on the same dashboard — each answers a different question about customer base health.
Check your interactive training completion rates alongside CRR if you run a learning or enablement product — the two metrics tend to move together because customers who actively engage with your content stay longer.
What is the difference between retention rate and churn rate?
Retention rate and churn rate are exact inverses: Churn Rate = 1 − Retention Rate. A 95% monthly retention rate equals 5% monthly churn. Both measure the same behavior from opposite directions. Churn emphasizes loss and is favored in financial models. Retention emphasizes continuity and is favored in customer success dashboards. Most subscription businesses report both; they are two views of one number.
One precision point matters when annualizing monthly churn: do not multiply by 12. A 2% monthly churn rate compounds to approximately 22% annual churn, not 24%.
The correct formula is:
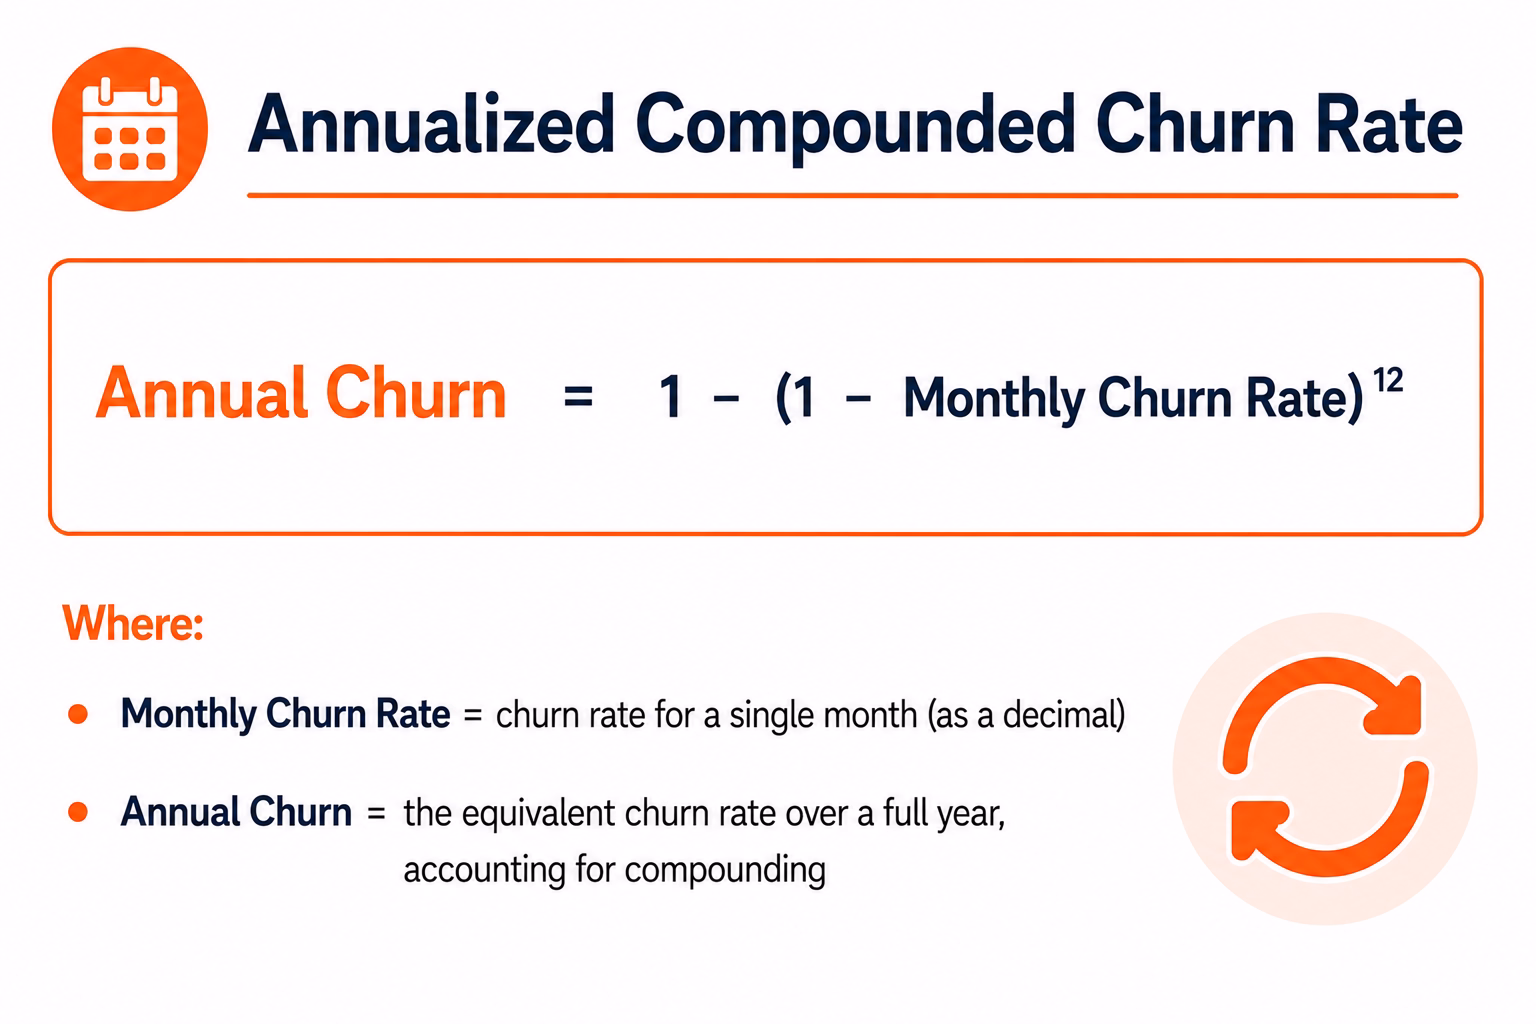
Multiplying instead of compounding overstates annual churn by about 9% — a meaningful error in any CAC payback or CLV model.
How churn connects to Customer Lifetime Value
The CLV formula shows exactly why retention improvements produce outsized profit gains: CLV = (Average Revenue Per Account × Gross Margin) ÷ Churn Rate. Because churn sits in the denominator, halving it doubles CLV. That is the mechanism behind the finding from Bain & Company, cited in the Harvard Business Review, that a 5% improvement in retention can increase profits 25–95%: the relationship is not linear, it is multiplicative. Every percentage point of retention extends the earning life of an account, and that extension compounds.
How does retention rate affect Customer Lifetime Value (CLV)?
Retention rate is the primary driver of Customer Lifetime Value. In the present-value CLV model:
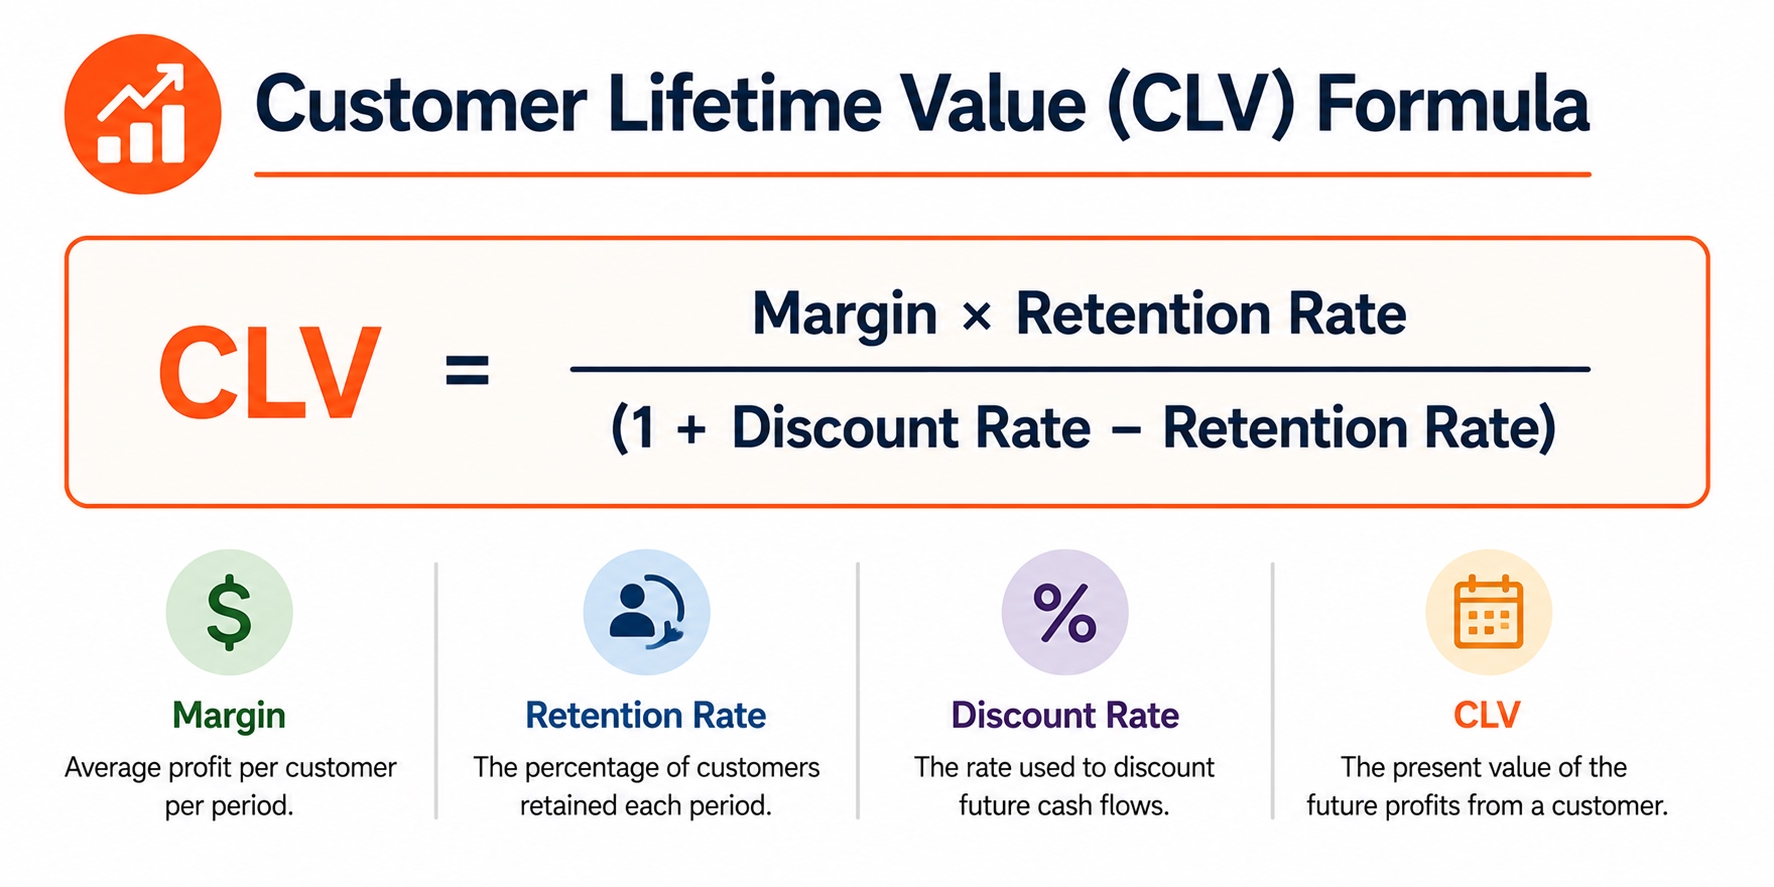
Moving from 80% to 90% retention does not lift CLV by 12.5% — it roughly doubles it. Each additional percentage point of retention extends the customer's active life and compounds the margin earned. The impact is exponential, not proportional.
Here is that non-linearity with numbers. Assume $10K annual margin per account and a 10% discount rate:
The implication for LTV:CAC is direct: higher retention raises CLV, which raises LTV:CAC, which justifies higher acquisition investment. Companies with structurally low retention hit a unit economics ceiling — no matter how efficient their sales motion, the math on new customer acquisition eventually stops working.
This is also why the acquisition-vs-retention cost comparison is so stark. A new customer costs 5–25 times more to acquire than an existing one costs to retain, according to Bain & Company. The gap exists because acquisition requires marketing spend, sales cycles, onboarding, and ramp time — costs that a renewing customer does not generate.
The exponential math behind retention became clear during a project with an enterprise software partner. They were suffering from a low LTV:CAC ratio due to flat expansion metrics.
We integrated Clixie interactive video elements directly into their customer training portal. By analyzing the engagement data, we noticed a distinct behavioral pattern: users who engaged with targeted, clickable in-video CTAs regarding 'Premium API Modules' had a 3.5x higher propensity to upgrade. By routing these high-intent interaction signals directly to the Account Executives, the company turned passive educational viewing into a predictable pipeline engine, accelerating their shift toward Best-in-Class NRR.
What are the most common mistakes in calculating retention rate?
The five most common retention calculation errors are: (1) not subtracting new customers from the ending count, which inflates CRR; (2) conflating CRR and NRR on the same report without labeling each; (3) multiplying monthly churn by 12 instead of compounding it; (4) benchmarking against industry-wide averages instead of ACV peers; and (5) reporting a single aggregate retention number without cohort segmentation. Each mistake distorts the metric in a specific, predictable direction.
Mistake 1 — Not subtracting new customers: Start with 500, add 200, end with 600. Naive CRR = 600/500 = 120% — impossible. Corrected: (600 − 200) ÷ 500 × 100 = 80%. Skipping the subtraction always inflates CRR and masks real churn.
Mistake 2 — Mixing CRR and NRR: The CS team reports "retention is 88%" using CRR. Finance reports "retention is 104%" using NRR. Both are accurate. Neither team knows what the other means. Label every retention metric with its type on every report, every time.
Mistake 3 — Multiplying monthly churn: 3% monthly × 12 = 36% (wrong). Correct annualization: 1 − (1 − 0.03)^12 = 30.6%. The multiplication error overstates annual churn by more than 17%.
Mistake 4 — Wrong benchmark: An 80% CRR looks poor against IT services (88%). It looks strong against retail (63%). Always benchmark against companies with the same ACV tier and business model.
Mistake 5 — No cohort segmentation: A single aggregate retention number hides which customers are churning and when. Cohort analysis groups customers by acquisition period, contract tier, or onboarding path, revealing which specific behaviors predict long-term retention — information that averaging destroys. Breaking retention into cohorts is the fastest way to identify which onboarding or adoption patterns separate retained customers from churned ones.
How does interactive video fit into a retention improvement strategy?
Interactive video improves retention not through passive viewing, but by generating behavioral data that linear video cannot produce. Every branching choice, quiz response, hotspot click, and timed CTA interaction creates a data point that maps to intent, attention, or buying signal. Those signals let customer success and sales teams intervene before churn registers in the metrics — the engagement layer beneath the retention number.
The behavioral difference between passive and interactive video is structural, not cosmetic. A passive video tells you it was watched. An interactive video tells you which decisions the viewer made, which topics held attention, and which CTAs they clicked. The interactive product demo format is particularly effective at this stage — branching paths generate decision data before the first sales call, turning "did they watch it" into "here is what they care about."
Where interactive video maps to the retention funnel
- Pre-call: Send a branching product demo. Track which features a prospect explores, how long they spend on each path, and where they drop. This behavioral data scores intent and informs the discovery call agenda.
- Onboarding: Replace linear tutorial videos with branching onboarding sequences. Track completion by account. Low completion in the first 30 days is a leading indicator of 90-day churn — catching it early through video engagement data creates an intervention window before it shows up in your CRR.
- Renewal: Send a re-engagement video 60 days before renewal with a timed CTA for an upsell or product review meeting. Non-engagement with the video is an early churn signal. Active engagement with the upsell branch is a direct expansion signal.
The shift from passive to interactive engagement changes the data available to your revenue team at every stage of the customer lifecycle. Most retention dashboards measure what already happened. Engagement data from interactive video tells you what is about to happen — and gives you time to change it.
To see this in action, look at a recent deployment we executed for an enterprise learning platform. They replaced their standard, linear product update videos with a Clixie-powered interactive format that featured branching decision paths and real-time knowledge checks.
The interactive engagement data allowed us to flag accounts that completely bypassed critical workflow paths—accounts that would have normally been marked as 'active' simply because the video played in the background. Within one quarter, this granular intent data correctly predicted three major renewal risks that the account's standard health score missed, while simultaneously driving a 14% increase in expansion revenue via contextual, in-video upgrade CTAs.
Frequently Asked Questions
What is retention ratio?
"Retention ratio" refers to two distinct metrics. In finance, it is the percentage of net income a company keeps rather than paying as dividends — also called the plowback ratio. In business operations, it is the percentage of customers or revenue retained over a period. The correct meaning depends on the professional context in which the term is used.
How do you calculate retention ratio?
For customer retention:
.avif)
For net revenue retention: NRR adds Expansion MRR to the numerator of the GRR formula.
What is a good retention rate?
For B2B subscription software, 100–120% NRR is considered good; above 130% is best-in-class, according to SaaS Capital. The average B2B CRR is approximately 72.5%. Industry CRR rates range from 88% in IT services to 55% in hospitality. Always benchmark against companies with the same average contract value and business model.
What is the difference between retention rate and churn rate?
Retention rate and churn rate are exact inverses: Churn Rate = 1 − Retention Rate. An 85% retention rate equals 15% churn for the same period. When annualizing monthly churn, compound the rate — a 2% monthly churn rate equals approximately 22% annual churn, not 24%.
Can retention rate exceed 100%?
Customer Retention Rate (CRR) cannot exceed 100% — it measures customer count. Net Revenue Retention (NRR) can exceed 100% when expansion revenue from upsells, cross-sells, and seat additions outpaces revenue lost to churn and contraction. This is called negative churn and is the most favorable revenue position for a subscription business.
What is net revenue retention?
Net Revenue Retention (NRR) measures the percentage of recurring revenue retained from existing customers over a period, including expansion revenue. Formula:
The median NRR for private B2B software companies is 106%, according to SaaS Capital.
What is gross revenue retention?
Gross Revenue Retention (GRR) measures recurring revenue retained from existing customers, excluding any expansion.
GRR is always capped at 100% and measures churn health in isolation — how much of the existing base is staying and maintaining spend.
How often should retention be measured?
Most subscription businesses measure retention monthly and report quarterly. Monthly tracking catches early warning signs before they compound. Quarterly reporting reduces noise and gives enough time for interventions to register. Annual retention numbers are useful for investor reporting and contract-cycle analysis.
What industries have the highest retention rates?
IT Services (88%), Insurance (83%), and Banking (75%) report the highest average customer retention rates, according to First Page Sage (2026). These industries benefit from long-term contracts, high switching costs, and regulatory continuity. Hospitality (55%) and Retail (63%) report the lowest rates due to low switching costs and high competition.
Why is customer retention important?
Retained customers are exponentially more valuable than new ones. Acquiring a new customer costs 5–25 times more than retaining an existing one, and a 5% increase in retention can raise profits 25–95%, according to Bain & Company. Retention also drives CLV: moving from 80% to 90% retention roughly doubles the lifetime value of each account.
What is the financial retention ratio?
The financial retention ratio — also called the plowback ratio — is the share of net income a company keeps rather than paying as dividends. Formula: (Net Income − Dividends) ÷ Net Income. It is the inverse of the dividend payout ratio. Growth-stage companies typically carry retention ratios above 90%; mature dividend-paying companies often show 20–40%.
What is negative churn?
Negative churn occurs when expansion revenue from existing customers exceeds revenue lost to churn and contraction in the same period. The result is NRR above 100%. Best-performing B2B software companies average 120–125% NRR, meaning their existing base generates 20–25 cents of new revenue for every dollar of starting MRR — even after accounting for all churn.
What is cohort retention analysis?
Cohort retention analysis groups customers who started in the same period and tracks their retention over time. It reveals which acquisition periods, onboarding experiences, or product tiers produce the strongest long-term retention — information that aggregate CRR hides by averaging all customers together. It is the most effective method for diagnosing the behavioral causes of churn.
How does retention affect customer lifetime value?
Retention rate is the primary driver of CLV. In the present-value model: CLV = (Margin × Retention Rate) ÷ (1 + Discount Rate − Retention Rate). Moving from 80% to 90% retention does not lift CLV by 12.5% — the impact is roughly a doubling. At a 10% discount rate and $10K annual margin, 80% retention produces ~$57K CLV; 90% retention produces ~$90K CLV.
Most businesses track retention as a number on a dashboard. The ones with the best retention track the behaviors that produce the number — engagement patterns, interaction decisions, and the follow-through signals that appear weeks before churn registers in your CRR.
Whether you are calculating the financial plowback ratio for an investor presentation, tracking CRR for a quarterly business review, or trying to move NRR from 98% to 108%, the formula is the starting point. The real work is understanding which actions your customers take — or stop taking — before the number moves.
Bring one onboarding, renewal, or follow-up video. We will show you which engagement signals Clixie captures from it, which ones predict retention risk, and what your team can do differently before the next renewal date. Book your demo here.
.png)
.png)